Image of the Tropopause and Atmospheric Layers (from the Space Shuttle)
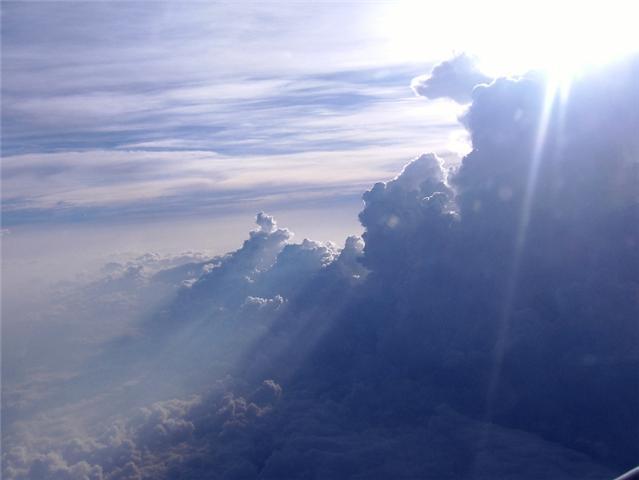
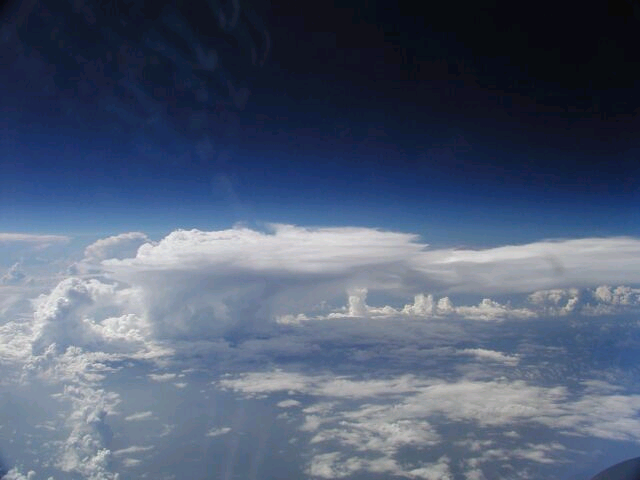
This image shows thunderstorm clouds in cross-section. The new younger cloud in the middle hasn't started to spread out yet, so doesn't have the large thin glaciated anvil at the top. The tropopause is the boundary between the red and white (in the tropics at about 16 km). The stratosphere is white because of the sulfate aerosol layer from the eruption of Mt. Pinatubo. This layer cooled the earth for several years after the eruption (1991 - 1993). The reason the layer persisted in the stratosphere for several years was because clouds don't occur in the stratosphere (very much), so the aerosol particles do not get rained out. The main removal mechanism is transport into the troposphere. This takes three years on average.
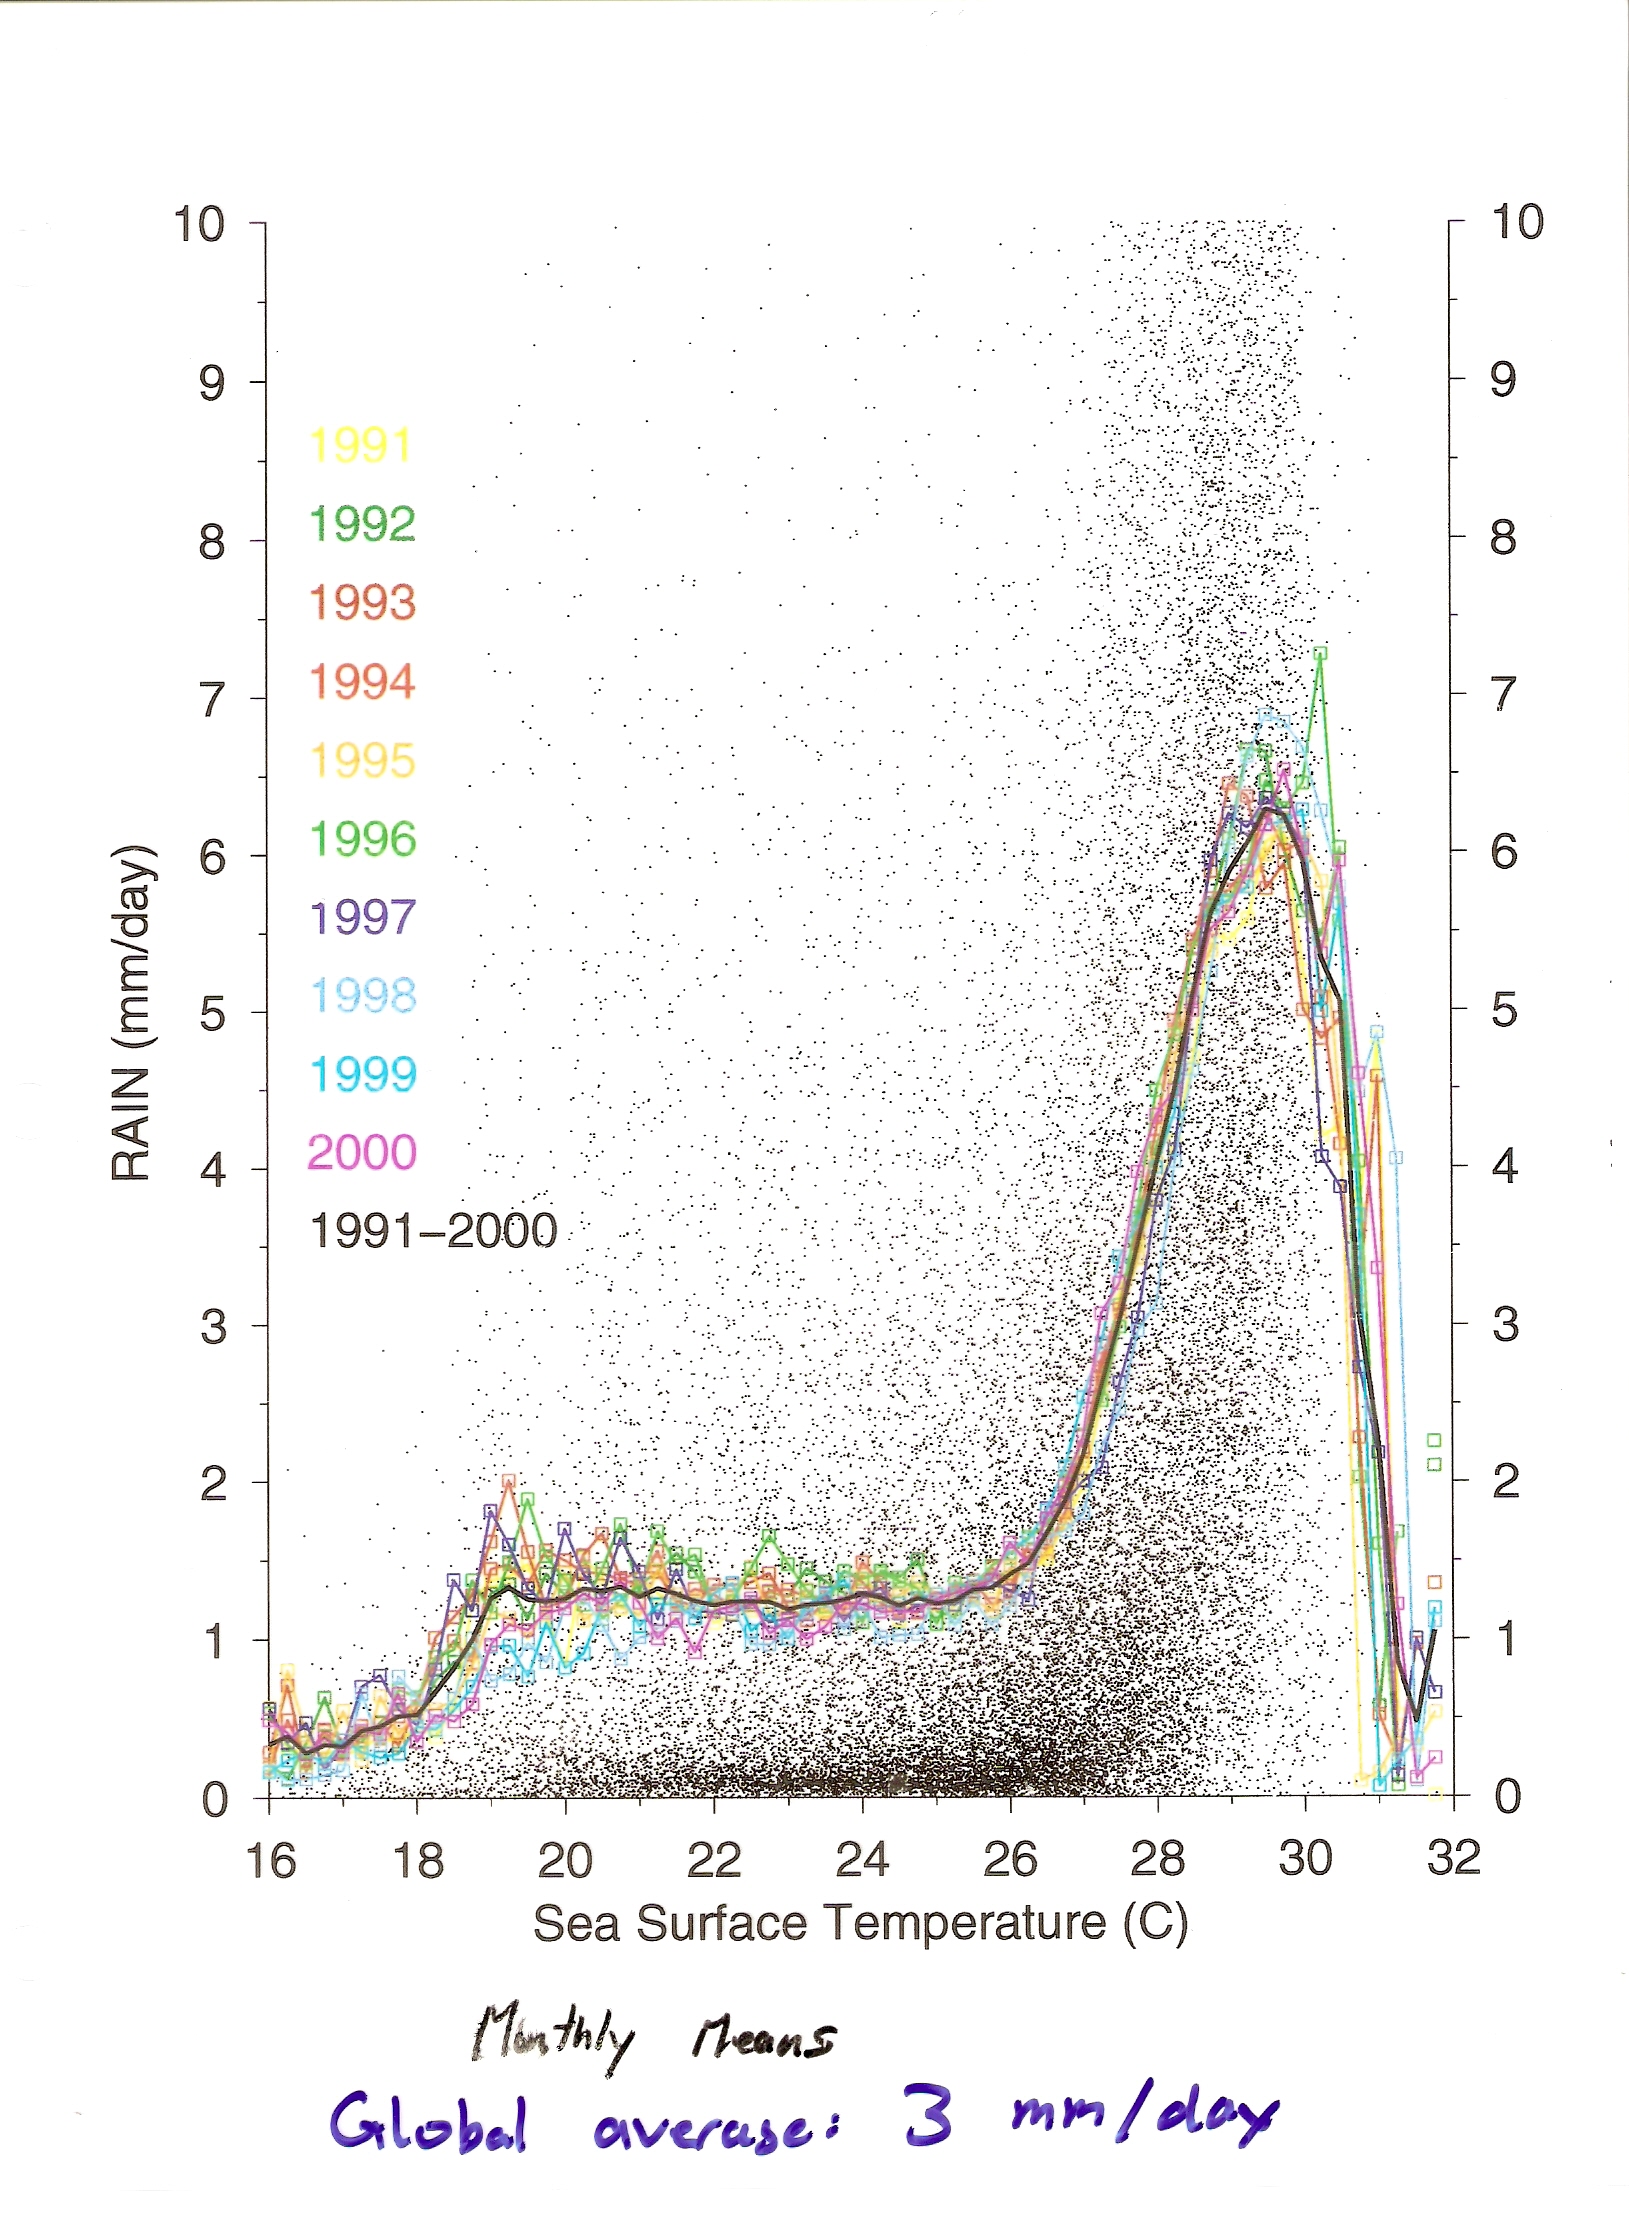
This figure shows the dependence of mean rain rate on SST in the tropics (30 S - 30 N). There are three odd characteristics to this plot. (1) Rain does not increase at all with SST for SST's between 19 C and 26 C. (2) The rainfall rate suddenly increases at a "magic" SST of 26 C. (3) The rainfall rate rapidly decreases as SST's go above 30 C. Why? In general higher sea surface temperatures should be associated with higher fluxes of heat and moisture into the atmosphere, which will favour moist convection (rainfall).
The rainfall decrease at high SST's is usually explained as being due to the fact that in order to generate very high SST's in the tropics, one requires that there be no blockage of solar radiation by clouds for several weeks. Rainfall produces extensive cirrus anvils which reflect solar radiation and cool the underlying ocean. Very high SST's can therefore only occur in their absence, i.e. if very low rain rates persist for several weeks.
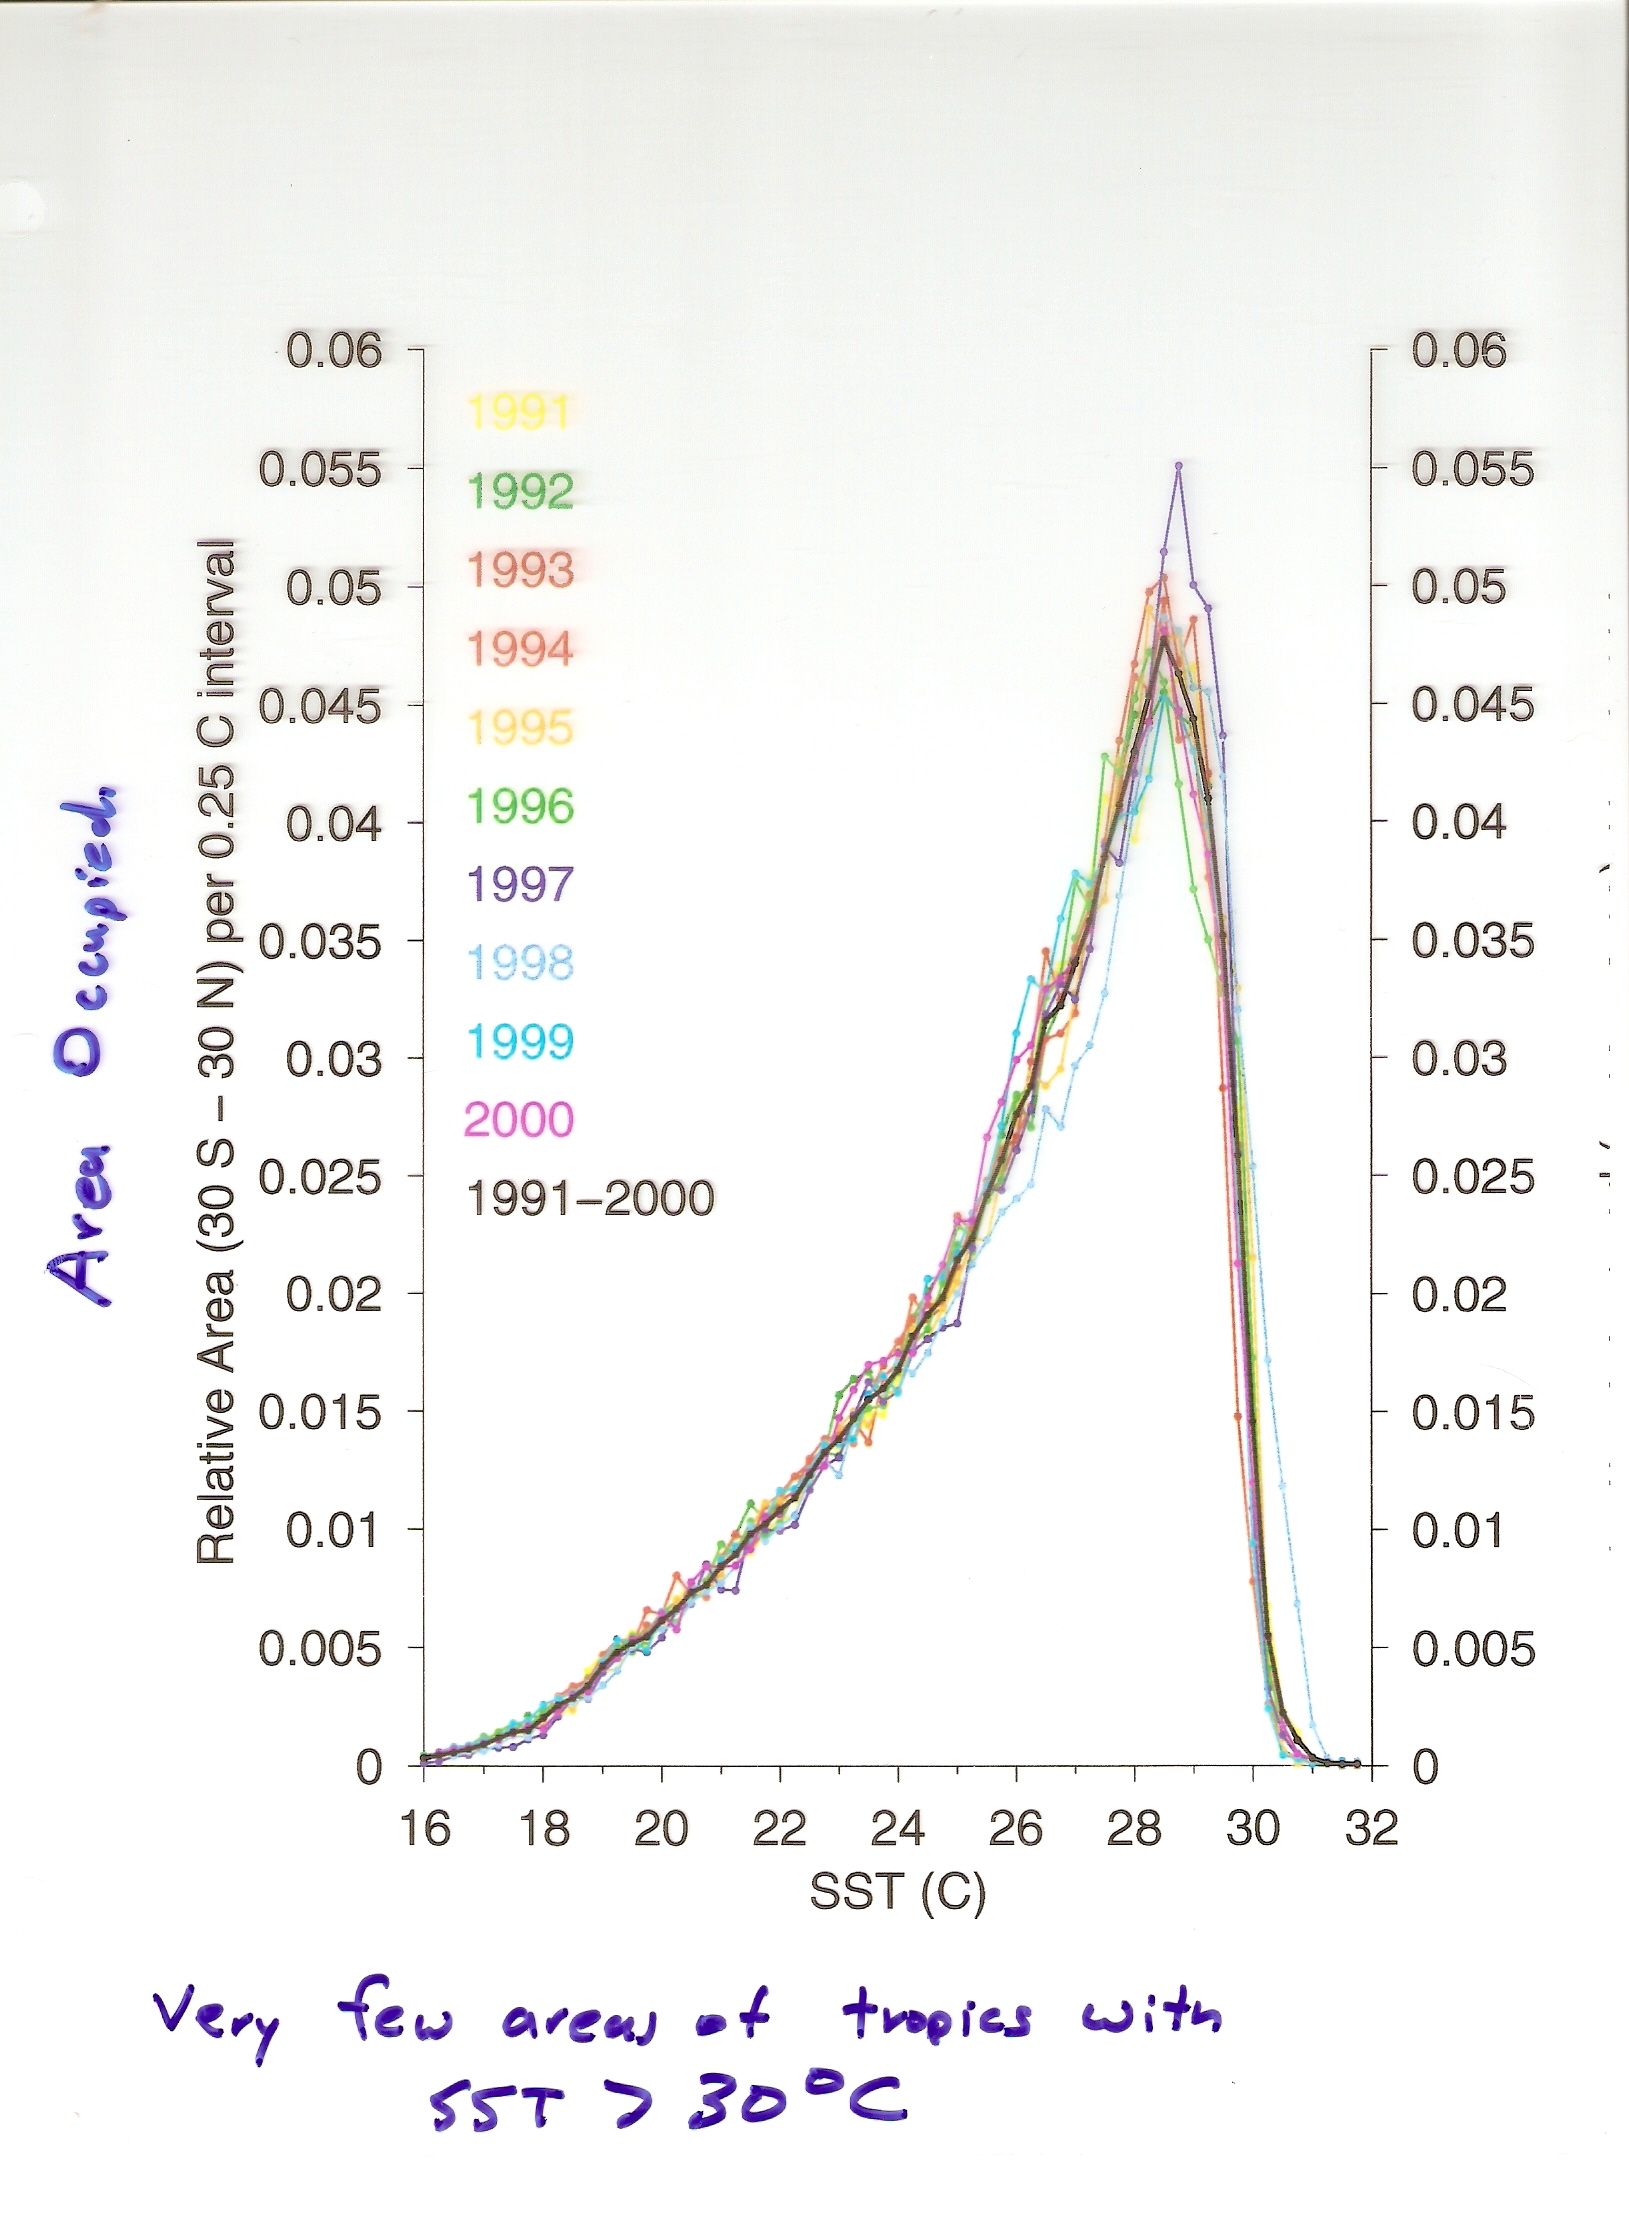
This figure shows the relative area in tropics as a function of SST. The most important aspect of this plot is that it is highly skewed: there is a gradual increase in area as a function of SST, reaching a peak near 28 C, and then an extremely rapid decrease.
Thunderstorms are most common over Florida where the convergent sea breeze circulations generates thunderstorms almost every afternoon in the summer (hence the Everglades). The low level northward flow from the Gulf of Mexico during summer provides the fuel source (warm moist air) for convection over the entire Eastern United States.
The tornado distribution is different from the thunderstorm distribution. It peaks in Oklahoma and then stretches northeastward toward Chicago.
There is a strong east - west gradient in rainfall in the Central United States associated with the northward flow of air from the Gulf of Mexico. The rainfall distribution in the Western United States is dominated by topography, especially the high rainfall region near the coast associated with the coastal mountain ranges.
These arrows show the northward low level transport up from the Gulf of Mexico, and the more eastward flow midlevel flow fo warm dry from Mexico.
Warm dry air from the higher elevations of Mexico creates an inversion at the op of the Boundary Layer which strongly inhibits convection (i.e. large CIN). Surface CAPE can therefore build up to larger values, and when convective clouds do break through the inversion, the large buoyancies can generate very large updraft speeds.
This is an image of the cloud that can be created as a gust front (pool of cold air generated by a downdraft) that moves forward into air near the surface. To generate an arcus cloud, the air near the surface must have quite high RH. The propagation of the gust front can be an important way to generate new convection (see radar image below).
This plot is rather complicated. The overall point is that, for a plume with no condensate, entrainment of colder more dense air simply leads to a continuous decrease in the buoyancy of an updraft. However, if the plume does have condensate, the entrainment of unsaturated air can lead to a much faster reduction of buoyancy, and even buoyancy reversal (due to the cooling associated with condensate evaporation).
Precipitating Convection heats the middle troposphere. This reduces the pressure at the surface due to a decrease in the column density. The low level convergence associated with this smaller surface pressure generates a cyclonic low level circulation. However, the heating also produces positive geopotential height, and a divergent, anticyclonic circulation in the upper troposphere. This occurs both for hurricanes and other types of convective heating. The horizontal spatial scale of these circulations is larger in the tropics where f is smaller.
Assume that the boundary layer shear is such that du/dz is positive. Then a convective cloud that is entraining air from both the north and the south can generate oppositely rotating updrafts, when the boundary layer northward vorticity is tilted into the vertical. Precipitation that develops between these two updrafts will generate a downdraft that creates a gust front near the surface that leads to a splitting of the two updrafts.
Most locations in the tropics (e.g. 2 and 5) exhibit distinct wet and dry seasons. The wet season is usually called a monsoon. 7 and 8 are examples of Mediterranean climates: rainy winters, and hot dry summers. The deep roots of grapes are adaptations to this climate. Continental climates like 10 and 11 have dry winters (since very cold) and a rainfall maximum in summer when the surface heating generates convective precipitation.
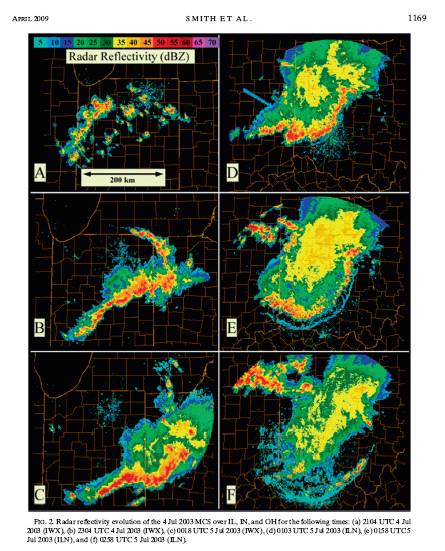
(A) A group of isolated convective updrafts plus one line of convection starting to organize itself into a squall line. The location is just south of Chicago.
(B) Downdraft cold pools from individual convective towers have combined and formed a squall line moving to the southeast away from Chicago.
(C) and (D) show development of more extensive stratiform precipitation.
In (E) and (F), the gust front is going ahead of the main stratiform precipitation and the convection at its leading edge is becoming disconnected from the main body.
Notice that the tornado detection is focused on WHERE THE ROTATION IS OCCURRING, not where the radar backscatter is largest. This is why they need the Doppler radar - which can measure velocity. And the crucial point is the detection of nearby horizontal winds moving in an opposite direction.
Also notice the discussion of the background shear and the convective inhibition. A strong capping inversion or CIN (the "warm layer aloft") that initially prevents CAPE release allows CAPE to build up to larger values. When finally the cap or CIN is finally broken or "eroded", the large values of CAPE promotes stronger updraft speeds, rotation, and thunderstorm development.
Note the discussion of southeast surface winds and upper level winds and how this veering is the source of rotation, at least initially. This vorticity is then tilted into the vertical.
Notice discussion of outflow: this is from the downdraft winds generated along the gust front. Not as strong as the tornado itself but pretty strong, strong enough here to blow over a tractor trailer.
The storms seem to be moving in a somewhat more northerly direction than usual.
Fort Cobb, OK Supercell Time-Lapse,
A nice time lapse video of a supercell updraft. The time lapse gives you a sense of the rotation. I guess there is a hint of a wall cloud, but no tornado is generated.
Another nice picture of a supercell updraft. Some funny comments.
Multiple Tornadoes from One Supercell,
Around 3:30 - 3:45 show a nice view of the rotation of a supercell updraft. Nothing interesting after 5:00.
Note the wall cloud at 0.37, possible tornado extending from bottom.
May 22, 2004 Supercell time lapse & tornado,
Rotation and turbulence at base of supercell updraft. You can see what looks to be a wall cloud appearing at times.
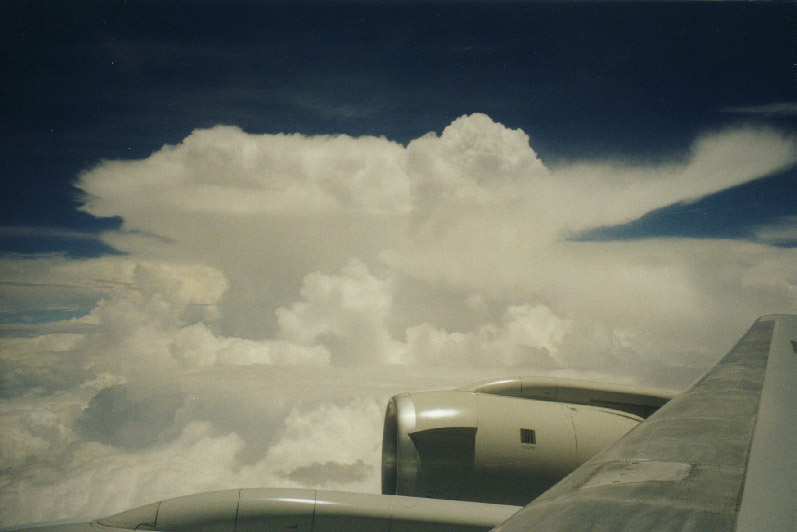
Convection is associated with vertical motions, usually turbulent, that arise from buoyancy accelerations in a fluid. But the range of convective motions in the atmosphere is best conveyed through images.